
Housing conditions in 2026 are split across the country. In the hottest Northeast and California markets, inventory remains far below pre-pandemic levels and competition is still intense. Hartford is one of the clearest examples.
Listings there are 63% below pre-pandemic levels, only 16.5% of homes saw price cuts in 2025, and 66% sold above asking price.
A very different pattern has taken hold in parts of the South and Mountain West.
Sixteen of the 50 largest U.S. metros entered spring 2026 with more active inventory than in 2019, and markets that regained that supply have generally posted weaker price growth or outright declines.
Buyer leverage has also improved at the national level. Months’ supply reached 4.5 months in February 2026, inventory growth continued to outpace sales, and sellers outnumbered buyers by 629,808 in February, the largest gap on record.
In the metros covered here, softer conditions are not only about weaker demand. New construction helped supply recover, competition eased, and buyers gained more room to negotiate.
City
Typical Home Value
YoY Home Value Change
YoY Inventory Change
Austin, TX
$422,024
-5.9%
+2.1%
Tampa, FL
$357,222
-3.4%
-2.6%
Charlotte, NC
$386,438
-0.4%
+10.9%
Phoenix, AZ
$446,470
-1.6%
+4.6%
Dallas, TX
$362,216
-3.3%
+3.8%
Oklahoma City, OK
$244,107
+1.4%
+10.2%
1. Austin, Texas

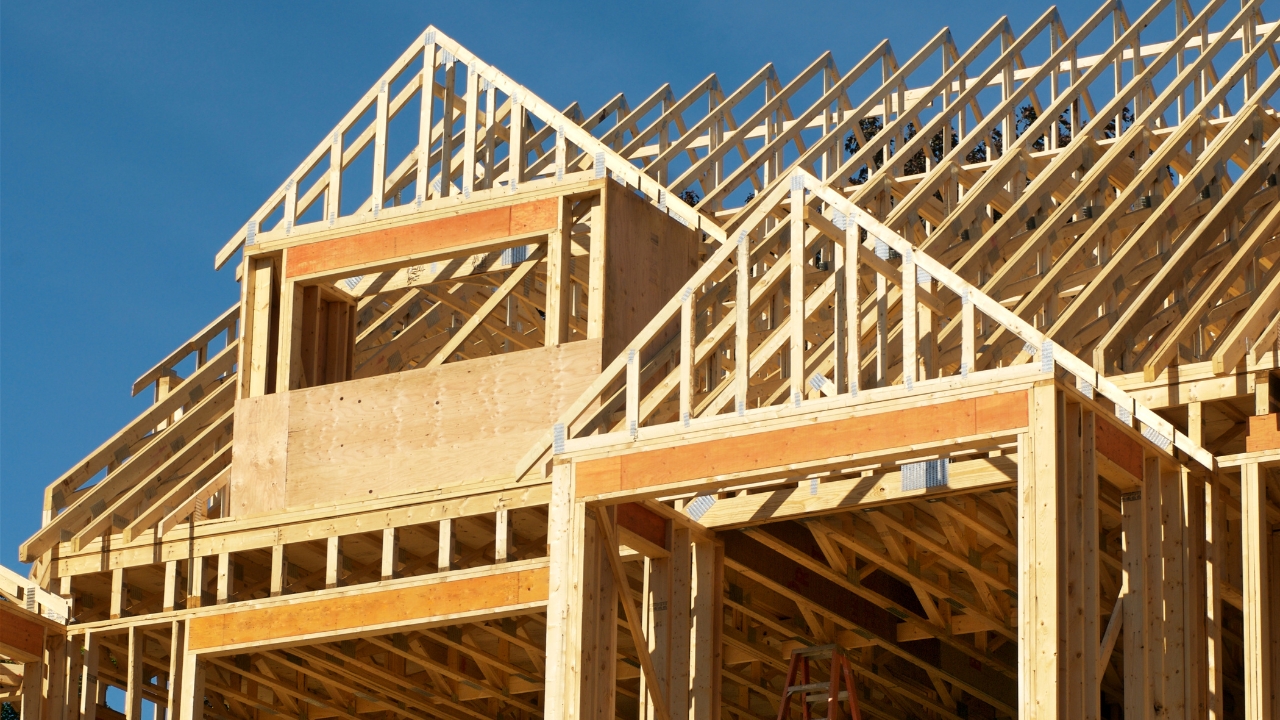
Austin offers the clearest example of supply catching up after the pandemic boom. Pandemic-era migration pushed prices sharply higher, and builders kept adding homes as demand surged.
Once migration slowed and mortgage rates moved higher, that formula became much harder to sustain.
Local wage growth could not support the same pace of price appreciation, and buyers grew more selective. Pressure that had once worked in sellers’ favor began to shift in the opposite direction.
New-home construction plays a central role in Austin’s reset. Large amounts of fresh supply entered the market just as buyer urgency faded.
Builders responded with price reductions and affordability-focused incentives, which pulled some shoppers toward new homes and away from resale listings. Existing homeowners then faced a tougher environment, with more competition and fewer buyers willing to stretch financially.
Current numbers make that change hard to miss:
Austin’s market no longer carries the urgency that defined the boom years. Buyers now have more room to negotiate, more listings to compare, and more evidence that waiting can pay off. Sellers, by contrast, face a market where aggressive pricing is no longer enough to guarantee a quick deal.
Another reason Austin works so well in this story is that it shows what happens when supply keeps arriving after demand cools. Price softness is not coming only due to weaker buyer activity.
Extra inventory has changed the balance of power. Bidding wars have become less common, price cuts are more visible, and buyers can take longer to make decisions.
2. Tampa, Florida
Tampa shows how quickly a hot pandemic market can cool once supply improves and bidding pressure fades. Gulf Coast markets saw major demand during the pandemic period as buyers chased warm weather, lower taxes, and more space. Competition intensified quickly, and home values jumped.
That urgency has eased as inventory recovered and buyers became more price sensitive.
A more buyer-friendly environment has now taken hold. Added supply means more homes are available within reach of buyers’ budgets, and competition is not as intense as it was a few years ago.
More choice usually leads to slower decisions, and slower decisions often force sellers to adjust expectations. Tampa fits that pattern closely.
Florida’s broader price picture adds important context. Several of the steepest annual home-price declines among the largest U.S. markets are now concentrated in the state. Tampa sits inside that broader correction story, even though conditions there are not collapsing outright. Cooling is visible, but it is happening in a measured way.
Key numbers help define Tampa’s shift:
A notable point in Tampa is that buyer leverage is not tied only to raw inventory totals. Less competition matters too.
Buyers have more time to compare homes, negotiate terms, and wait for price reductions. Sellers can no longer rely on the automatic urgency that defined the pandemic market.
Price cuts also suggest that expectations are still adjusting. Many sellers are listing in a market that no longer rewards aspirational pricing the way it once did. More listings, softer demand, and a slower sales pace create a setting where concessions become more common.
Tampa now captures a broader Florida shift. Pandemic bidding wars have faded, added supply has taken some heat out of the market, and buyers hold more leverage than they did during the frenzy years.
3. Charlotte, North Carolina

Charlotte remains a growth market, but housing conditions no longer look overheated. Population gains and a solid local economy continue to support demand, yet supply growth has started to change the tone of the market.
Buyers still want homes in Charlotte. The problem for sellers is that buyers now have more alternatives and less pressure to act immediately.
New construction has helped push inventory higher, and that increase in supply has eased competition on individual listings. During the boom, buyers often had to move fast and bid aggressively. Current conditions look far less intense.
More available homes mean more comparison shopping, more negotiation, and less confidence that every listing will attract multiple offers.
Recent market data shows how much conditions have shifted:
Charlotte’s pricing data is especially telling. Home values are only slightly lower year over year, which suggests demand has not disappeared. Inventory growth, however, is much stronger than price growth.
That gap is giving buyers more leverage and reducing the pressure that once helped sellers command premium pricing.
A slipping share of the original list price also signals a meaningful change. Sellers are getting less of what they initially ask, and that points to a market where negotiation has become much more common.
Buyers can push for better terms in a way that was far less realistic during the boom.
Charlotte works well as a middle-ground example. Demand is still present. Local fundamentals are still solid. Yet supply growth and builder activity have taken enough heat out of the market to make conditions meaningfully friendlier for buyers.
4. Phoenix, Arizona
View this post on Instagram
Phoenix tells a straightforward inventory-rebound story. Pandemic demand pushed the market sharply higher, but affordability pressures eventually caught up with buyers.
As inventory recovered and post-boom normalization set in, price momentum slowed. The result is a market that has cooled without falling into a full-scale collapse.
A key idea runs through Phoenix’s recent performance: once inventory returns closer to pre-pandemic norms, price growth tends to weaken.
Phoenix fits that pattern well. More homes are available, buyers are no longer forced into the same kind of rushed decisions, and sellers have less control over the pace of negotiations.
Fresh market numbers show that reset clearly:
Phoenix also fits a broader Sun Belt and Western pattern where both pricing and demand have softened. Rising mortgage costs played a major role, but improved inventory matters too. Buyers can now weigh more options, and that tends to reduce the kind of panic buying that inflated prices during the boom.
Price softness in Phoenix does not point to a dramatic crash. Instead, it points to a market where balance is slowly returning. Restored inventory alone can cool momentum by giving buyers time and choice. Once that happens, sellers lose some of the edge they held when listings were scarce.
Phoenix is useful in this story because it shows that a market can weaken in an orderly way. Inventory does not have to flood the market overnight for pricing power to erode. A steady rebound in supply can be enough to cool competition and shift leverage toward buyers.
5. Dallas, Texas
@movingtodallastexas Moving to Dallas in 2026 and Beyond! (New Construction Vs Pre-Owned) #movingtodfw #movingtodallas #dfwrealtor #dallasrelocation #dallastexas ♬ original sound – Jaran Ramsey
Dallas adds needed nuance because rising supply has not erased local demand. Economic conditions remain more supportive here than in some other cooling Sun Belt markets, and that has helped Dallas hold up better than Austin.
Even so, inventory gains and softer pricing power show that buyers are gaining ground.
Builder incentives matter in Dallas just as they do in other major markets. More supply has reached buyers at a time when affordability remains stretched.
Incentives can help move hesitant shoppers into deals, but they also put added pressure on resale sellers who have to compete with new homes offering discounts or better financing terms.
Recent numbers show a market that is cooling, but not falling apart:
Dallas supports the broader thesis without pushing it too far. Supply is improving faster than pricing power, and sellers are adjusting. At the same time, local economic resilience has kept Dallas in firmer shape than metros where the correction has been more severe.
Price cuts remain one of the clearest signs of that shift. Nearly half of sellers lowered their asking price in February, which points to a market where buyers are no longer accepting initial pricing at the same rate. Negotiation has become a bigger part of the process, and sellers need more patience.
Dallas works as a useful counterpoint to Austin. Both metros are dealing with more supply and weaker pricing momentum.
Dallas, however, still has enough local support to keep the market steadier. Buyers have gained leverage, but demand has not vanished. That balance makes Dallas one of the more nuanced examples in the group.
FAQs
Closing Thoughts
A clear split defines the 2026 housing market. Scarcity still controls many Northeast and California metros, where inventory remains far below pre-pandemic levels and sellers continue to hold the upper hand.
Taken together, those trends point to a market where leverage now depends heavily on location. Scarcity still fuels bidding wars in a handful of metros, but many Southern and Western markets no longer reward sellers the way they did during the pandemic boom.
More homes, more concessions, and more price cuts have given buyers something they lacked during those years: real negotiating power and time to make a decision.
My name is Barbara Novak, I am a journalist focused on economic, religious, popular culture, and demographic trends shaping the United States. Professional life has been built around careful reporting, long term pattern analysis, and close attention to social forces that influence policy, culture, and public discourse.
Work currently appears on usacli.org, where reporting centers on national data, institutional change, faith-based movements, pop culture, population shifts, and economic behavior. Writing emphasizes clarity, verification, and balance, with a strong commitment to primary sources, expert interviews, and historical records.
Coverage often connects economic indicators with social behavior, showing how financial pressure, migration patterns, and belief systems interact over time. Religious reporting examines church affiliation, civic engagement, and moral frameworks without advocacy, allowing facts and context to guide conclusions.