
The average salary in the United States in 2026 is about $63,795 per year, according to Bureau of Labor Statistics data. But that number only tells part of the story.
A salary of $63,795 in rural Mississippi does not buy the same lifestyle as $63,795 in San Francisco. Housing costs, state taxes, local job markets, and cost of living can make the same paycheck feel generous in one place and tight in another.
That is why looking at the national average alone is not enough. To really understand what people earn in 2026, you need to see how salaries vary by state, region, industry, education level, and gender. Whether you are negotiating a raise, thinking about moving, or just trying to see how your income compares, this guide gives you a clearer picture of what salary looks like across the country.
2026 Salary Snapshot
Here are a few of the most important numbers at a glance:
What the National Average Really Means

Before comparing states, it helps to understand what these national salary numbers actually represent.
The first thing to know is that average salary and median salary are not the same thing. The average is pulled upward by high earners, which makes it useful for broad comparisons, but not always a great reflection of what a typical worker earns. In 2026, the average annual salary is about $63,795, while the median is closer to $61,984.
For most people, the median is the better benchmark.
It is also important not to confuse individual salary with household income. Household income is much higher because many households include two earners. So if you are comparing your own pay to national data, make sure you are looking at the right category.
Wages have continued to grow in 2026, but many workers still do not feel dramatically ahead. Pay is rising, yet housing, food, and other essentials remain expensive in many parts of the country. A higher paycheck does not always translate into more financial breathing room.
That is especially true in states like Massachusetts and California. These states post some of the highest average salaries in the US, but they also come with some of the highest living costs. A big salary looks impressive on paper, but what really matters is what is left after rent, taxes, and everyday expenses.
Salary Differences Across States
The table below covers all 50 states, showing both the estimated average individual salary and the median household income (which includes all earners in the household). Data is sourced from the Bureau of Labor Statistics, U.S. Census Bureau, and Bureau of Economic Analysis.
State
Avg. Salary (Ind.)
Median HH Income
Region
Key Industries
Alabama
$54,700
$60,786
Southeast
Automotive, aerospace
Alaska
$68,500
$76,918
West
Oil, fishing, federal gov
Arizona
$61,200
$70,919
Southwest
Tech, tourism, real estate
Arkansas
$48,600
$55,432
South
Agriculture, retail, manufacturing
California
$73,200
$76,190
West
Technology, entertainment, agriculture
Colorado
$67,800
$82,716
Mountain
Tech, aerospace, tourism
Connecticut
$70,100
$82,341
Northeast
Finance, healthcare, defense
Delaware
$62,400
$72,724
Mid-Atlantic
Finance, pharma, chemical
Florida
$55,900
$65,801
Southeast
Tourism, healthcare, real estate
Georgia
$58,300
$62,401
Southeast
Logistics, tech, film
Hawaii
$57,800
$83,173
West
Tourism, military, agriculture
Idaho
$54,300
$66,750
Mountain
Agriculture, tech, manufacturing
Illinois
$63,500
$69,611
Midwest
Finance, manufacturing, agriculture
Indiana
$54,900
$63,040
Midwest
Manufacturing, life sciences
Iowa
$56,300
$66,849
Midwest
Agriculture, manufacturing, insurance
Kansas
$55,200
$64,521
Midwest
Agriculture, aviation, energy
Kentucky
$52,100
$58,218
South
Manufacturing, equine, bourbon
Louisiana
$48,600
$60,986
South
Energy, petrochemical, tourism
Maine
$54,700
$65,175
Northeast
Healthcare, tourism, fishing
Maryland
$69,800
$82,646
Mid-Atlantic
Federal gov, defense, biotech
Massachusetts
$76,600
$83,430
Northeast
Biotech, finance, education, tech
Michigan
$57,400
$63,994
Midwest
Automotive, manufacturing, tech
Minnesota
$65,700
$78,984
Midwest
Healthcare, finance, retail
Mississippi
$43,100
$52,985
South
Agriculture, manufacturing, casinos
Missouri
$56,100
$63,594
Midwest
Healthcare, finance, agriculture
Montana
$51,600
$62,218
Mountain
Agriculture, tourism, energy
Nebraska
$58,200
$68,394
Midwest
Agriculture, finance, insurance
Nevada
$56,400
$66,274
West
Gaming, tourism, mining, tech
New Hampshire
$67,200
$85,492
Northeast
Tech, manufacturing, finance
New Jersey
$71,400
$84,257
Mid-Atlantic
Pharma, finance, tech
New Mexico
$51,000
$56,861
Southwest
Oil, federal gov, tourism
New York
$74,800
$68,795
Northeast
Finance, media, tech, healthcare
North Carolina
$56,200
$63,611
Southeast
Tech, pharma, banking, agriculture
North Dakota
$60,200
$73,959
Midwest
Energy, agriculture, manufacturing
Ohio
$55,100
$62,952
Midwest
Manufacturing, healthcare, finance
Oklahoma
$52,800
$59,673
South
Energy, agriculture, aerospace
Oregon
$63,100
$73,836
West
Tech, forest products, manufacturing
Pennsylvania
$58,500
$67,676
Mid-Atlantic
Healthcare, manufacturing, finance
Rhode Island
$62,200
$74,008
Northeast
Healthcare, education, manufacturing
South Carolina
$52,600
$59,318
Southeast
Manufacturing, tourism, tech
South Dakota
$54,700
$68,626
Midwest
Agriculture, finance, tourism
Tennessee
$55,600
$61,145
South
Healthcare, auto, music
Texas
$61,200
$63,448
South
Energy, tech, healthcare, finance
Utah
$63,300
$79,449
Mountain
Tech, outdoor recreation, finance
Vermont
$56,200
$67,674
Northeast
Healthcare, education, tourism
Virginia
$65,400
$77,420
Mid-Atlantic
Federal gov, tech, defense
Washington
$72,300
$85,482
West
Tech, aerospace, agriculture
West Virginia
$47,100
$51,615
South
Energy, healthcare, manufacturing
Wisconsin
$57,800
$68,037
Midwest
Manufacturing, healthcare, agriculture
Wyoming
$58,900
$68,002
Mountain
Energy, agriculture, tourism
Sources: Bureau of Labor Statistics (OEWS), U.S. Census Bureau ACS, Bureau of Economic Analysis. Individual salary estimates are derived from BLS occupational wage data. Household income figures are from Census Bureau CPS ASEC and ACS 1-Year estimates.
Top 10 Highest-Paying States in 2026

The highest-paying states in the US are heavily concentrated in the Northeast and on the West Coast. This geographic clustering reflects the presence of high-density technology, finance, and biomedical industries in these regions.
Massachusetts leads the country with an average individual salary of $76,600. Its economy is powered by biotech, finance, higher education, and a deep concentration of skilled professional jobs. Boston and the Route 128 corridor continue to attract employers that pay well above national averages.
New York follows closely at $74,800, driven by finance, media, healthcare, and technology.
California, at $73,200, remains one of the biggest salary engines in the country thanks to Silicon Valley, entertainment, and a massive professional services economy.
Washington, at $72,300, benefits from the presence of Microsoft, Amazon, and Boeing, while also giving workers an extra advantage: no state income tax.
These states offer some of the biggest paychecks in the country, but they also come with steep living costs. In cities like San Francisco, Seattle, Boston, and New York, a salary that seems strong on paper may not stretch as far as expected.
Rank
State
Avg. Salary
Median HH Income
Salary Driver
1
Massachusetts
$76,600
$83,430
Biotech, finance, elite universities
2
New York
$74,800
$68,795
Wall Street, media, tech, healthcare
3
California
$73,200
$76,190
Silicon Valley tech, entertainment
4
Washington
$72,300
$85,482
Microsoft, Amazon, Boeing
5
New Jersey
$71,400
$84,257
Pharma, finance, proximity to NYC
6
Connecticut
$70,100
$82,341
Finance, insurance, defense
7
Maryland
$69,800
$82,646
Federal government, defense, biotech
8
Alaska
$68,500
$76,918
Oil industry, federal employment
9
Colorado
$67,800
$82,716
Tech corridor, aerospace, energy
10
New Hampshire
$67,200
$85,492
Tech, manufacturing, no income tax
The 10 Lowest-Paying States in 2026
These 22 states are raising their minimum wage in 2026 https://t.co/eszNDkCJmY
— USA TODAY (@USATODAY) January 11, 2026
At the other end of the spectrum, the lowest-paying states are concentrated mostly in the South and parts of the Mountain West.
Mississippi ranks last, with an average individual salary of $43,100.
West Virginia follows at $47,100.
Arkansas and Louisiana both sit at $48,600.
New Mexico comes in at $51,000.
These lower averages are tied to industry mix, educational attainment, and slower growth in high-paying sectors. But again, context matters. A lower salary in a low-cost state can sometimes go further than a mid-range salary in a high-cost metro area.
Mississippi is a good example. Its wages are the lowest in the country, but living costs are also significantly below the national average. That does not erase the income gap, but it does change what those dollars can actually buy.
Rank
State
Avg. Salary
Median HH Income
Key Context
50
Mississippi
$43,100
$52,985
Lowest in the US; but cost of living is 13% below national avg
49
West Virginia
$47,100
$51,615
Declining coal sector, limited industry diversification
48
Arkansas
$48,600
$55,432
Agriculture and retail dominant; lower urban density
47
Louisiana
$48,600
$60,986
Energy sector offsets, but income inequality is high
46
New Mexico
$51,000
$56,861
High reliance on federal gov and oil; poverty rate elevated
45
Montana
$51,600
$62,218
Rural economy; tourism growing but wages remain modest
44
Kentucky
$52,100
$58,218
Manufacturing and logistics; lower ed attainment levels
43
Oklahoma
$52,800
$59,673
Energy sector volatility affects overall wage levels
42
South Carolina
$52,600
$59,318
Growing manufacturing base; tourism along the coast
41
Alabama
$54,700
$60,786
Automotive growth; aerospace; lower cost of living
The Real Purchasing Power Question: Mississippi’s $43,100 average salary goes further than it might appear. With a cost of living 13% below the national average and among the lowest housing costs in the country, workers in Mississippi retain more purchasing power per dollar than the raw salary figure suggests.
Regional Trends
Looking at salary by region makes some of the bigger patterns easier to see.
Region
Avg. Salary Range
Median HH Income
Economic Characteristics
Northeast
$67,000 – $76,600
$68,000 – $85,000
Finance, biotech, elite education, defense
West Coast
$63,000 – $73,200
$73,000 – $85,000
Tech, entertainment, aerospace, agriculture
Mid-Atlantic
$62,000 – $71,400
$67,000 – $84,000
Federal government, pharma, finance, defense
Mountain West
$51,000 – $67,800
$62,000 – $82,000
Tech growth (CO, UT), energy, tourism
Midwest
$54,900 – $65,700
$62,000 – $79,000
Manufacturing, agriculture, healthcare, finance
South
$43,100 – $61,200
$52,000 – $65,000
Energy, logistics, tourism; lower cost of living
The Northeast consistently outperforms other regions on nominal wages, but the Mountain West – particularly Colorado and Utah – is closing the gap rapidly as tech companies establish a growing presence in cities like Denver, Salt Lake City, and Boulder.
The South, while lower on the wage scale, has attracted significant corporate relocation activity, with Texas and Florida absorbing major financial services and technology employers from higher-cost coastal states.
Education Still Has a Huge Impact on Pay

Education remains one of the strongest predictors of income in the United States.
Workers without a high school diploma earn the least on average. High school graduates do better, but there is still a noticeable jump for people with some college or an associate’s degree. The biggest leap comes at the bachelor’s degree level, where earnings rise sharply.
In 2026, workers with a bachelor’s degree earn roughly 43% more than those with only a high school diploma. That gap adds up over time. Over a full career, the difference can amount to hundreds of thousands of dollars in additional earnings.
Education Level
Median Annual Salary
Median Weekly
Unemployment Rate
vs. HS Diploma
No High School Diploma
$38,376
$738
6.2%
-21%
High School Diploma
$48,360
$930
4.2%
Baseline
Some College, No Degree
$53,040
$1,020
3.8%
+10%
Associate Degree
$57,148
$1,099
3.5%
+18%
Bachelor’s Degree
$69,381
$1,334
2.5%
+43%
Master’s Degree
$80,200+
$1,542+
2.0%
+66%
Professional Degree (JD, MD)
$122,876
$2,363+
1.5%
+154%
Doctoral Degree
$100,000+
$1,924+
1.5%
+107%
Sources: Bureau of Labor Statistics 2024 data; National Center for Education Statistics; SmartAsset analysis of BLS data.
Professional degrees lead the pack. Lawyers, doctors, and dentists tend to earn the highest salaries overall, reflecting years of training, licensing requirements, and strong market demand.
That said, a four-year degree is not the only path to solid income. Skilled trades such as plumbing, electrical work, welding, and HVAC can produce very strong earnings without a bachelor’s degree, especially in states with active construction markets or strong unions.
The Gender Pay Gap Is Still Significant
View this post on Instagram
The gender wage gap remains a major part of the US pay landscape in 2026.
Men working full-time earn a median of $1,333 per week, while women earn $1,076 per week. Over the course of a year, that adds up to a gap of more than $13,000.
This gap is shaped by several factors. Women are more likely to work in lower-paying care and service occupations, are underrepresented in some of the highest-paying technical and executive roles, and may face slower advancement or interruptions in career progression.
Research also continues to find that a measurable pay gap remains even after accounting for occupation and hours worked.
Men (Median Weekly Earnings)
Women (Median Weekly Earnings)
All workers (16+): $1,333/week ($69,316 annualized)
All workers (16+): $1,076/week ($55,952 annualized)
Men 25+: $1,405/week ($73,060 annualized)
Women 25+: $1,145/week ($59,540 annualized)
The size of the gap varies by state, and it tends to be smaller in places with stronger pay transparency laws, a larger public-sector workforce, or stronger union presence.
Highest and Lowest Paying Industries in 2026
One of the biggest drivers of salary is the industry you work in. A closer look at the 8 most popular engineering jobs shows how specialized roles in software, civil, and aerospace fields push average pay even higher.
Technology, finance, healthcare, biotech, and aerospace continue to be among the best-paying sectors in 2026. Retail, food service, hospitality, and many agricultural jobs remain near the bottom.
This is one reason some states rank so highly overall. Massachusetts and Washington do not just pay more by accident. They are packed with industries that offer high salaries.
Industry Sector
Avg. Annual Salary
Wage Trend
Key States
Information Technology & Software
$112,000+
Strong growth
CA, WA, TX, NY
Finance & Insurance
$98,000+
Stable growth
NY, CT, NJ, IL
Healthcare (Physicians, Surgeons)
$210,000+
High demand
All states
Biotechnology & Pharma
$95,000+
Strong growth
MA, NJ, CA, MD
Aerospace & Defense
$90,000+
Stable
WA, CA, TX, FL
Legal Services
$88,000+
Moderate growth
NY, CA, DC, IL
Education (K-12)
$58,000-$72,000
Slow growth
All states
Retail Trade
$38,000-$48,000
Modest growth
All states
Food Service & Hospitality
$32,000-$42,000
Slow growth
FL, NV, CA, HI
Agriculture (Field Workers)
$30,000-$40,000
Slow growth
CA, TX, FL, WA
According to the BLS, total employer compensation costs in wholesale trade averaged $53.03 per hour worked in December 2025, making it among the highest compensating broad industry categories. Retail trade, by contrast, averaged $26.41 per hour worked – including benefits – highlighting the wide spread between industry sectors.
What Counts as a “Good Salary” in 2026?

There is no single number that counts as a “good salary” everywhere in the United States.
In expensive places like New York City or San Francisco, a single adult may need $100,000 to $120,000 just to live comfortably. Housing alone can consume a huge portion of take-home pay.
In cities like Boston, Seattle, or Los Angeles, a comfortable single-adult salary often falls in the $80,000 to $100,000 range.
In growing but more affordable metros like Denver, Austin, or Atlanta, many people can live comfortably on $65,000 to $85,000.
In smaller Midwestern cities or lower-cost Southern areas, a salary of $55,000 to $70,000 can still go a long way, especially if housing is reasonable.
The right number depends less on the paycheck itself and more on what that paycheck can actually support where you live.
The No-Income-Tax Advantage
One factor that can make a big difference in real take-home pay is whether your state collects income tax.
Nine states do not tax earned income, including Texas, Florida, Washington, Tennessee, Nevada, and Alaska. For workers earning average or above-average salaries, this can create a meaningful financial edge over time.
Washington stands out in particular because it combines high salaries with no state income tax, making it especially attractive for higher earners. Texas also remains popular for the same reason, especially among workers in energy, tech, and finance.
Of course, no-income-tax states make up that revenue in other ways, such as higher sales taxes or property taxes. But for many workers, the lack of state income tax still adds to the appeal.
What Determines Your Salary? Key Factors

Individual salary outcomes in 2026 are shaped by a complex combination of factors. Understanding which levers matter most gives workers and job seekers a clearer sense of how to maximize their earning potential.
1. Location
Where you live or work is the single biggest external factor shaping your salary. The same role – say, a registered nurse or a software developer – can pay 40% to 80% more in a high-cost metro than in a rural market.
Location determines both the direct wage offer and the cost-of-living context that shapes how far that wage goes.
2. Industry
Industry choice is arguably the most consequential career decision a worker can make from a salary perspective. Technology, finance, and healthcare consistently top the wage charts.
Retail, food service, and agriculture consistently sit at the bottom. Switching industries – even within the same type of role – can result in 20% to 50% salary changes.
3. Education and Credentials
As the education data above shows, each step up the educational ladder produces meaningful salary increases. However, credentials beyond a bachelor’s degree are most valuable in specific fields – law, medicine, research, and academia.
In technology and many business roles, demonstrated skills and experience can substitute for or exceed the value of advanced degrees.
4. Experience and Seniority
Salary tends to increase significantly with experience in most professional fields. Entry-level workers in many industries earn 40% to 60% less than their senior counterparts doing essentially similar work. The steepest gains typically occur in the first 10 to 15 years of a career.
5. Union Membership
Union membership provides a statistically significant wage premium in the United States. BLS data consistently shows union members earn higher median wages than non-union workers in comparable roles, particularly in manufacturing, transportation, construction, and public sector employment.
6. Remote Work Status
As of 2026, roughly 58% of American professional workers operate in hybrid or fully remote arrangements. Many employers have implemented location-based pay scales, offering slightly reduced salaries to workers in lower-cost markets.
Workers who secured high-wage contracts before their employer implemented geographic pay adjustments have sometimes retained a significant compensation advantage.
US Salary Growth Trends: 2015 to 2026
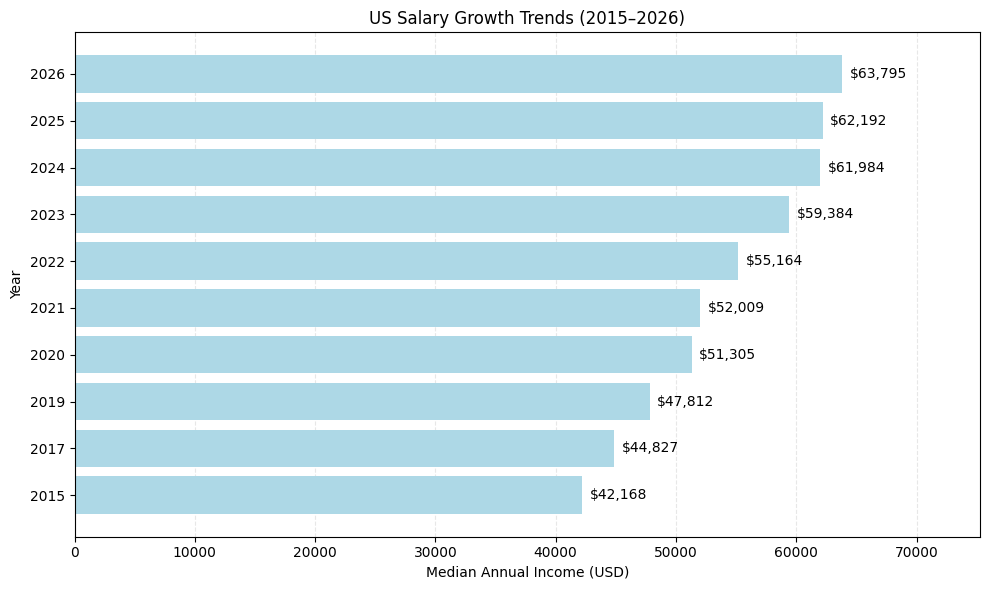
Understanding how wages have evolved over the past decade provides important context for current salary negotiations and financial planning.
Historical median annual income data reflect full-time wage and salary workers.
The apparent spike in 2020 median income reflects a statistical artifact: the COVID-19 pandemic disproportionately eliminated low-wage jobs, which pushed the median of the remaining employed workers upward even as total earnings fell sharply.
States With No Income Tax: The Effective Salary Advantage
Nine US states levy no state income tax on earned income. For workers earning above-average salaries, this can represent a significant annual windfall – often equivalent to a 3% to 7% salary increase compared to high-tax states.
No Income Tax State
Avg. Individual Salary
Effective Salary Boost*
Key Industries
Alaska
$68,500
+3.5%-5.5%
Oil, fishing, federal government
Florida
$55,900
+2.5%-6.0%
Tourism, healthcare, real estate
Nevada
$56,400
+3.0%-5.5%
Gaming, tourism, tech (growing)
New Hampshire
$67,200
+3.5%-5.0%
Tech, financial services
South Dakota
$54,700
+2.5%-5.0%
Agriculture, finance, tourism
Tennessee
$55,600
+3.0%-5.5%
Healthcare, automotive, logistics
Texas
$61,200
+3.0%-6.0%
Energy, tech, healthcare, finance
Washington
$72,300
+3.5%-6.5%
Tech (Microsoft, Amazon), aerospace
Wyoming
$58,900
+2.5%-5.0%
Energy, agriculture, tourism
*Effective salary boost is an estimate based on typical state income tax rates for workers at median income levels. Actual savings vary significantly by income level, filing status, and deductions.
View this post on Instagram
Washington State stands out as the most valuable no-income-tax state for high earners in 2026. It combines the third-highest average individual salary in the US ($72,300) with no state income tax – a combination that makes it one of the most financially favorable states for professional workers in the country.
Average Salary by Race and Ethnicity in the US
Significant wage disparities exist across racial and ethnic groups in the United States. These gaps reflect complex intersections of historical inequality, occupational segregation, educational access differences, and discrimination.
Group
Median Weekly Earnings
Annualized
Vs. White Non-Hispanic
Asian
$1,620/week
$84,240
+3%
White (Non-Hispanic)
$1,236/week
$64,272
Baseline
Hispanic or Latino
$945/week
$49,140
-24%
Black or African American
$900/week
$46,800
-27%
Source: Bureau of Labor Statistics, Q3 2025.
Asian workers lead all groups with a median weekly income of $1,620, reflecting high concentration in technology, medicine, and finance occupations. The Black-white wage gap and Hispanic-white wage gap remain significant policy concerns, with both groups earning roughly one-quarter less than white non-Hispanic workers at the median.
It is worth noting that between 2023 and 2024, Hispanic household income increased 5.5% and Asian household income rose 5.1%, while Black household median income declined 3.3% – a pattern that highlights diverging trends across racial groups in the current economic cycle.
Sources and Methodology
- Bureau of Labor Statistics — Occupational Employment and Wage Statistics (OEWS)
- Bureau of Labor Statistics — Usual Weekly Earnings of Wage and Salary Workers
- Bureau of Labor Statistics — Employment Cost Index
- Bureau of Labor Statistics — Employer Costs for Employee Compensation
- Bureau of Labor Statistics — Education Pays
- Bureau of Labor Statistics — Union Members Summary
- Bureau of Labor Statistics — Employment Situation
- U.S. Census Bureau — Income in the United States: 2024
- U.S. Census Bureau — Household Income in States and Metropolitan Areas: 2024
- Bureau of Economic Analysis — Regional Price Parities by State and Metro Area
- Social Security Administration — Education and Lifetime Earnings
- MIT Living Wage Calculator
- WFH Research — February 2026 update
- Tax Foundation — State Individual Income Tax Rates and Brackets, 2026
I am Imran Burton, a passionate researcher dedicated to uncovering the numbers that shape daily life across the United States. I turn raw data into stories, making complex trends clear and engaging for everyone. My work shines a light on the facts behind the headlines, helping readers see the country through fresh and honest numbers.